Dew Point vs Humidity: How to Read the Chart (November 2026)
A dew point vs humidity chart compares two measures of moisture: dew point is a temperature, while relative humidity is a percentage. Read both alongside air temperature to understand how conditions change.
On this page (8 sections)
- What does a dew point vs humidity chart compare?
- How do you read a dew point vs humidity chart?
- Why can humidity change while dew point barely moves?
- How can you compare two chart readings fairly?
- What does a dew point and humidity chart tell you indoors?
- Which readings matter for a greenhouse or grow tent?
- Which tools help you read the values over time?
- How should you choose between dew point and relative humidity?
A dew point vs humidity chart compares two ways to describe moisture in the air: dew point is a temperature, and relative humidity is a percentage. Read both alongside air temperature to see whether changing conditions reflect a change in moisture or mainly a change in temperature.
Relative humidity changes when temperature changes. Dew point tends to stay steadier when the amount of water vapor in the air stays similar.
What does a dew point vs humidity chart compare?
A dew point vs humidity chart compares dew point, a temperature, with relative humidity, a percentage. The readings describe related conditions, but they are not interchangeable.
Dew point is the temperature at which air would become saturated if cooled without changing its moisture content. Relative humidity compares the air's current water vapor with the amount it could hold at its current temperature.
That temperature link explains why relative humidity can rise overnight as the air cools. The dew point may change little during the same period.
For a fuller explanation of the difference between dew point and humidity, start with the units: degrees for dew point and percent for relative humidity.
How do you read a dew point vs humidity chart?
Read the air temperature first, then compare the dew point and relative humidity at the same time. A small gap between air temperature and dew point means the air is closer to saturation.
Charts use different layouts. One may plot dew point and air temperature as lines, while another may show temperature and relative humidity in separate panels.
Look for the time axis and confirm that the readings cover the same place and period. Indoor and outdoor values can differ, and a chart combining them may make the relationship harder to follow.
What does a small temperature and dew point gap mean?
When dew point is close to air temperature, the air is near saturation. Fog or condensation may form if air cools to the dew point, though a chart alone doesn't tell you exactly where or when that will happen.
When the gap is wider, the air is farther from saturation at that moment. This does not mean the air is dry in every practical sense; dew point and relative humidity both need context.
What does a humidity percentage show?
Relative humidity tells you how close the air is to saturation for its current temperature. A reading of 50% RH means the air is at half of its saturation level under those conditions, not that it contains half the water vapor of another air sample.
This is why 50% RH on a cool morning and 50% RH on a hot afternoon do not necessarily mean the air has the same moisture content. Compare dew point too when you want to follow moisture through temperature swings.
Why can humidity change while dew point barely moves?
Relative humidity can rise as air cools even when its water vapor content changes very little. Cooler air reaches saturation with less water vapor, so the percentage can increase without a matching rise in dew point.
Imagine a warm afternoon followed by a cooler night. If the moisture in the air remains fairly steady, the dew point may stay similar while the temperature falls and relative humidity climbs.
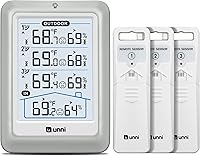
A station that records temperature and humidity over time can help you see that pattern. For example, the La Crosse Technology station displays indoor and wireless outdoor temperatures with humidity, plus dew point and heat index views.
For a basic account of how sensors collect moisture readings, see how a hygrometer measures humidity. Consistent placement matters when comparing changes from one day to the next.
How can you compare two chart readings fairly?
Compare readings from the same location and note the air temperature at each time. A humidity percentage without temperature can hide an important part of the change.
Use a simple three-step check:
- Find the air temperature and relative humidity at each time.
- Compare the dew point values, if available.
- Check whether the temperature changed enough to explain a shift in relative humidity.
If dew point stays close but relative humidity rises as temperature drops, the change may mainly reflect cooling. If dew point rises too, the air likely has more water vapor than before, assuming the readings are accurate and comparable.
Avoid comparing an indoor sensor with a distant outdoor station as if they measured the same air. Sun, ventilation, walls, appliances, and sensor placement can all affect local temperature and humidity.
What does a dew point and humidity chart tell you indoors?
An indoor chart helps you spot patterns in a room, such as humidity rising after a shower or changing when heating runs. It cannot identify the cause by itself, but the timing can guide a closer look.
Place the sensor away from direct sunlight, supply vents, exterior doors, and sources of heat or moisture. Keep its position consistent so changes are easier to interpret.
A combined temperature and humidity sensor can record both values for comparison. Learn what to expect from a temperature and humidity sensor before choosing a location or reading its chart.
For longer-term trends, the SONOFF AirGuard TH offers app charts, six-month records, and dew point insights.
Which readings matter for a greenhouse or grow tent?
Use temperature and relative humidity together in a greenhouse or grow tent, and follow dew point when you need to understand how close air is to saturation. One percentage alone does not describe the full moisture picture.
Keep sensors where they represent the plants' environment without touching wet surfaces or sitting in direct sun. Compare the readings at consistent times, especially when lights, fans, or vents change the temperature.
The SONOFF SNZB-02WD has an IP65 rating for splash-prone settings and provides app charts for temperature and humidity. It does not specify a dew point display, so choose a different option if you need that value shown.
If a grow tent runs above 80°F, this guide to controlling grow tent humidity above 80°F covers the relationship between heat, moisture, and ventilation.
Which tools help you read the values over time?
Choose a display or sensor that shows the specific values you need and makes trends easy to compare. For a quick glance, a station display may be enough; for history, look for charts and records.
The La Crosse station shows indoor and wireless outdoor temperatures with humidity, dew point, and heat index views. Its color comfort bars represent humidity levels indoors and outdoors.
The SONOFF AirGuard TH adds app charts, minute-by-minute records for the recent 24 hours, and longer records with maximum, minimum, and average curves. The SONOFF IP65 sensor focuses on temperature and humidity monitoring in damp locations, with charts that can be viewed and exported.
Check that your chosen device measures the location you care about. A display with multiple readings is only useful for comparison when you know which sensor and room each value represents.
How should you choose between dew point and relative humidity?
Use relative humidity to see how close air is to saturation at its current temperature, and dew point to compare moisture across changing temperatures. For many practical readings, you need both plus air temperature.
Choose a chart that matches the question you have. Relative humidity is useful for comfort and room monitoring, while dew point helps explain why the same humidity percentage can mean different moisture conditions in warmer or cooler air.
For quick checks, compare all three values at the same time. For trends, use a sensor that records data and keep its location consistent.
When you compare a dew point vs humidity chart, use dew point for a steadier moisture comparison across temperature changes, and relative humidity to understand saturation at the current temperature. Review the dew point measurement basics to understand how a station derives that value.
Frequently asked questions
What does a dew point vs humidity chart show?
A dew point vs humidity chart shows how relative humidity and dew point relate as temperature changes. Relative humidity is a percentage of how close the air is to saturation at its current temperature, while dew point is a temperature.
Use both readings with air temperature to understand the conditions.
Can relative humidity rise while dew point stays the same?
Yes. If air cools while its moisture content stays about the same, relative humidity can rise even though the dew point stays close to its prior value.
That is why a percentage alone can give a different impression from the dew point during a cool evening or overnight.
Does a higher dew point mean more moisture in the air?
A higher dew point generally means the air contains more water vapor, assuming comparable pressure and measurement conditions. Relative humidity can change simply because temperature changes, so dew point can be more useful for comparing moisture across times with different temperatures.
How do I read a dew point chart?
Find the dew point value and compare it with the air temperature. The closer those temperatures are, the closer the air is to saturation.
A chart may show dew point directly or give temperature and humidity values that a weather station uses to calculate it.
Which sensor helps track humidity and dew point trends?
Choose a sensor that records temperature and humidity over time and offers dew point information if you need that measure. The SONOFF AirGuard TH provides app charts and dew point insights, while the La Crosse station shows dew point alongside indoor and outdoor readings.